Brief history
Inception
In the first days of the pandemic, during the lockdown period (March - April 2020), the population's need for correct and complete data, statistics and graphics about the troublesome medical situation in the country was dire.
To meet this need, initially a small official platform was created by a few volunteers which later became the official Government Covid platform. But this was incomplete. The population wanted much more data and analysis than what was presented on this site.
Thus, encouraged by the media support of the statistics regarding to the pandemic that we personally started to present (initially on Facebook), we decided to create a dedicated platform where all public data about the pandemic will be broadly available, in an easy to access and understandable way.
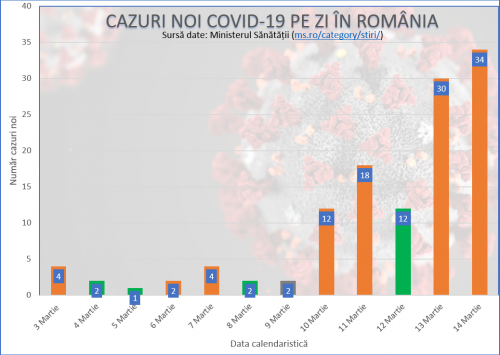
This is how Graphs.ro was born, initially a collection of data extracted from the daily information bulletins about the Covid-19 pandemic. Available nationwide, the objective of this platform was to inform citizens and reduce anxiety caused by the pandemic with the help of science and knowledge.
The site was launched in April 2020 and continues to operate to this day. The newly available data, taken from the Ministry of Health, were manually entered daily. The platform was the only source of information for the population about certain advanced statistics. For example, it was the only place where our collaborator, Valentin Pârvu, calculated the figure R (reproduction rate of the virus), a figure quoted in all media sources and never officially calculated by the Ministry of Health.
Fast-track development
With the launch of the nationwide vaccination campaign, the Graphs.ro platform started to centralize this data as well, proudly being the only organization that processed and visually provided all public data about its progression.
In addition, Graphs.ro was the only entity that offered and still offers data about the pandemic in electronic format (Open Data - JSON) that is extremely important for other entities in the country or abroad in order to follow the evolution from their own platforms.
Furthermore, at the end of 2021 and the beginning of 2022, we teamed up with the World Bank on a regional project to implement a dashboard to present the vaccination status and number of Covid cases. It was implemented in Bihor and Timiș counties and enjoyed a very high visibility.
Public reception
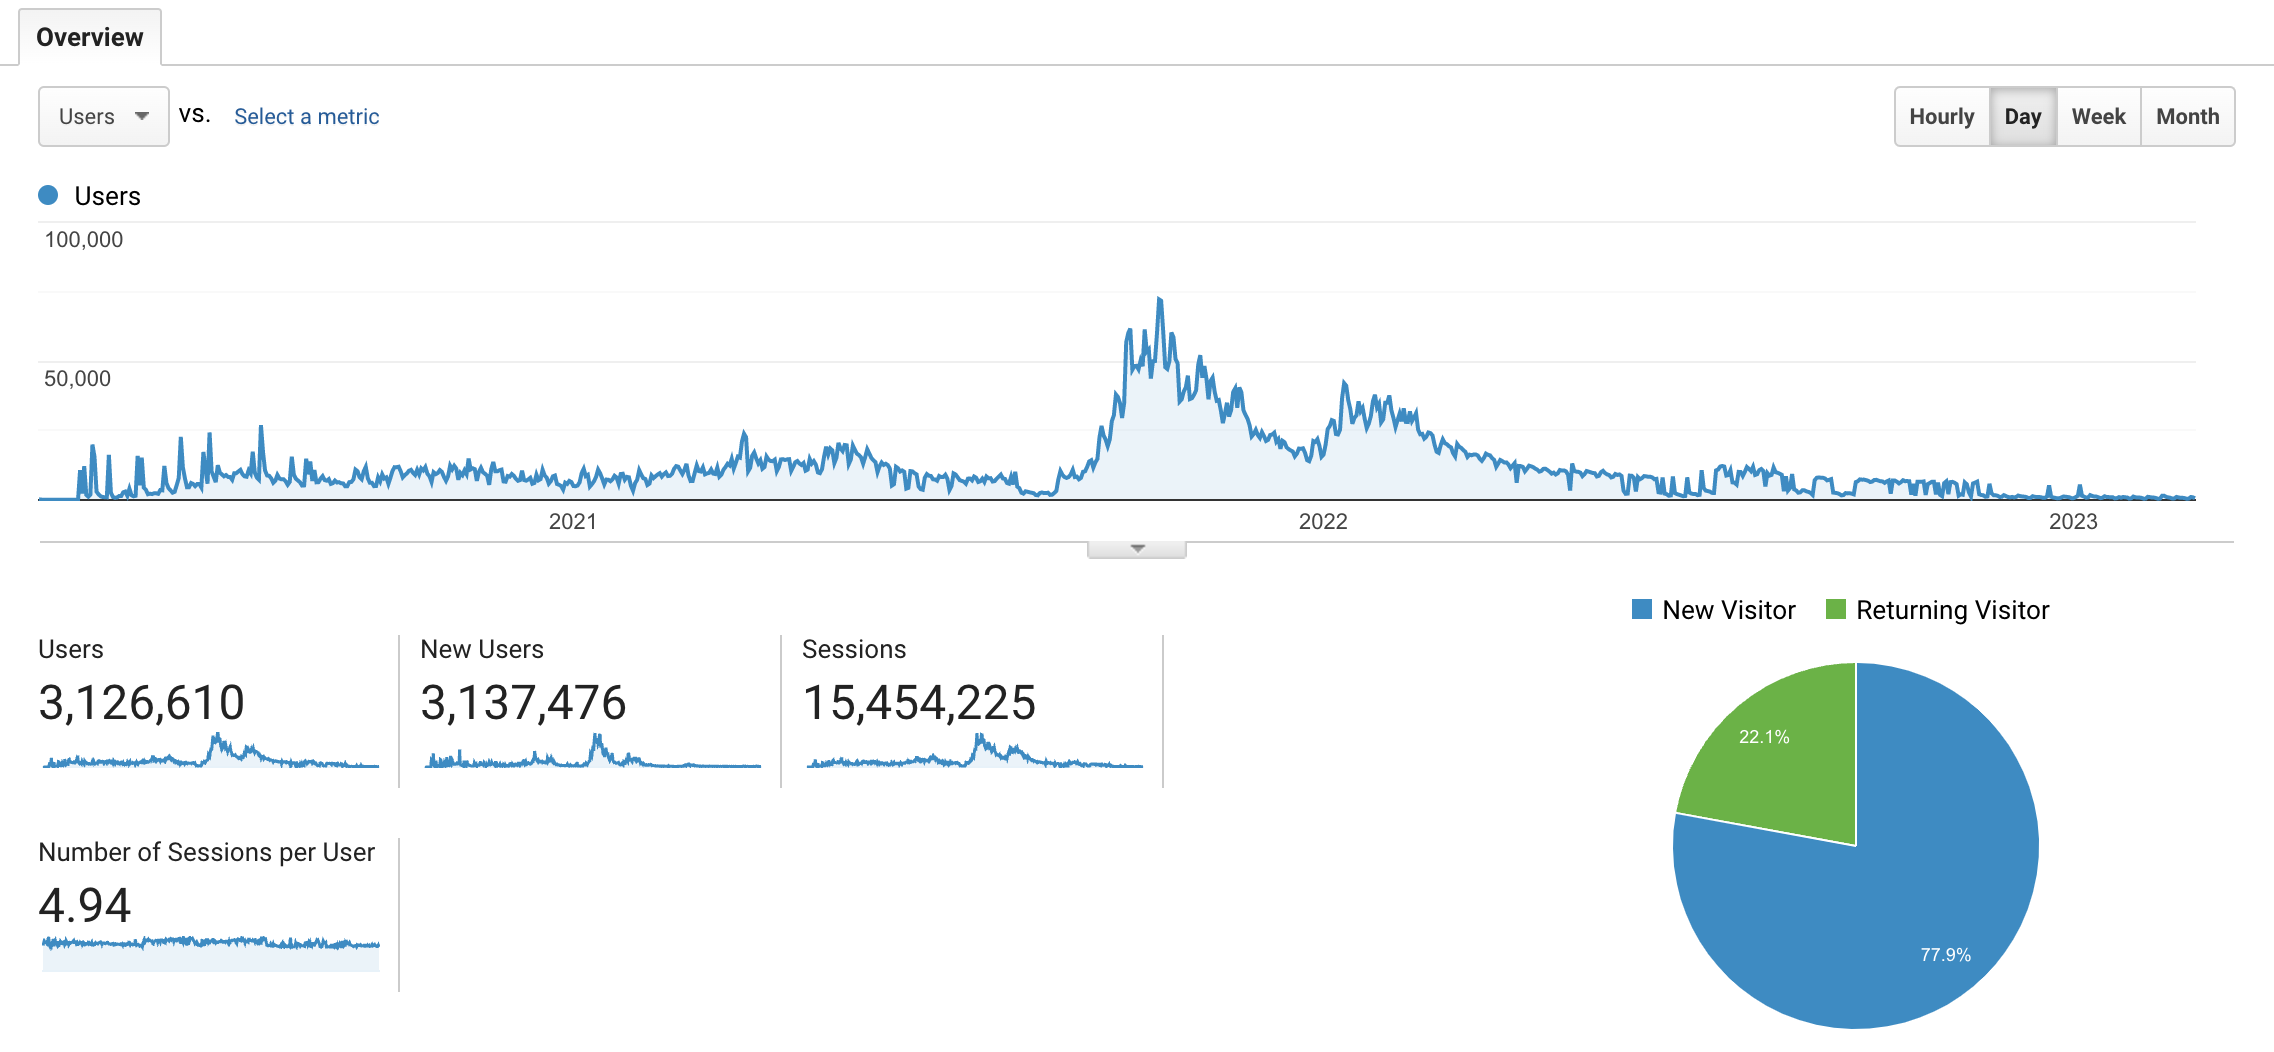
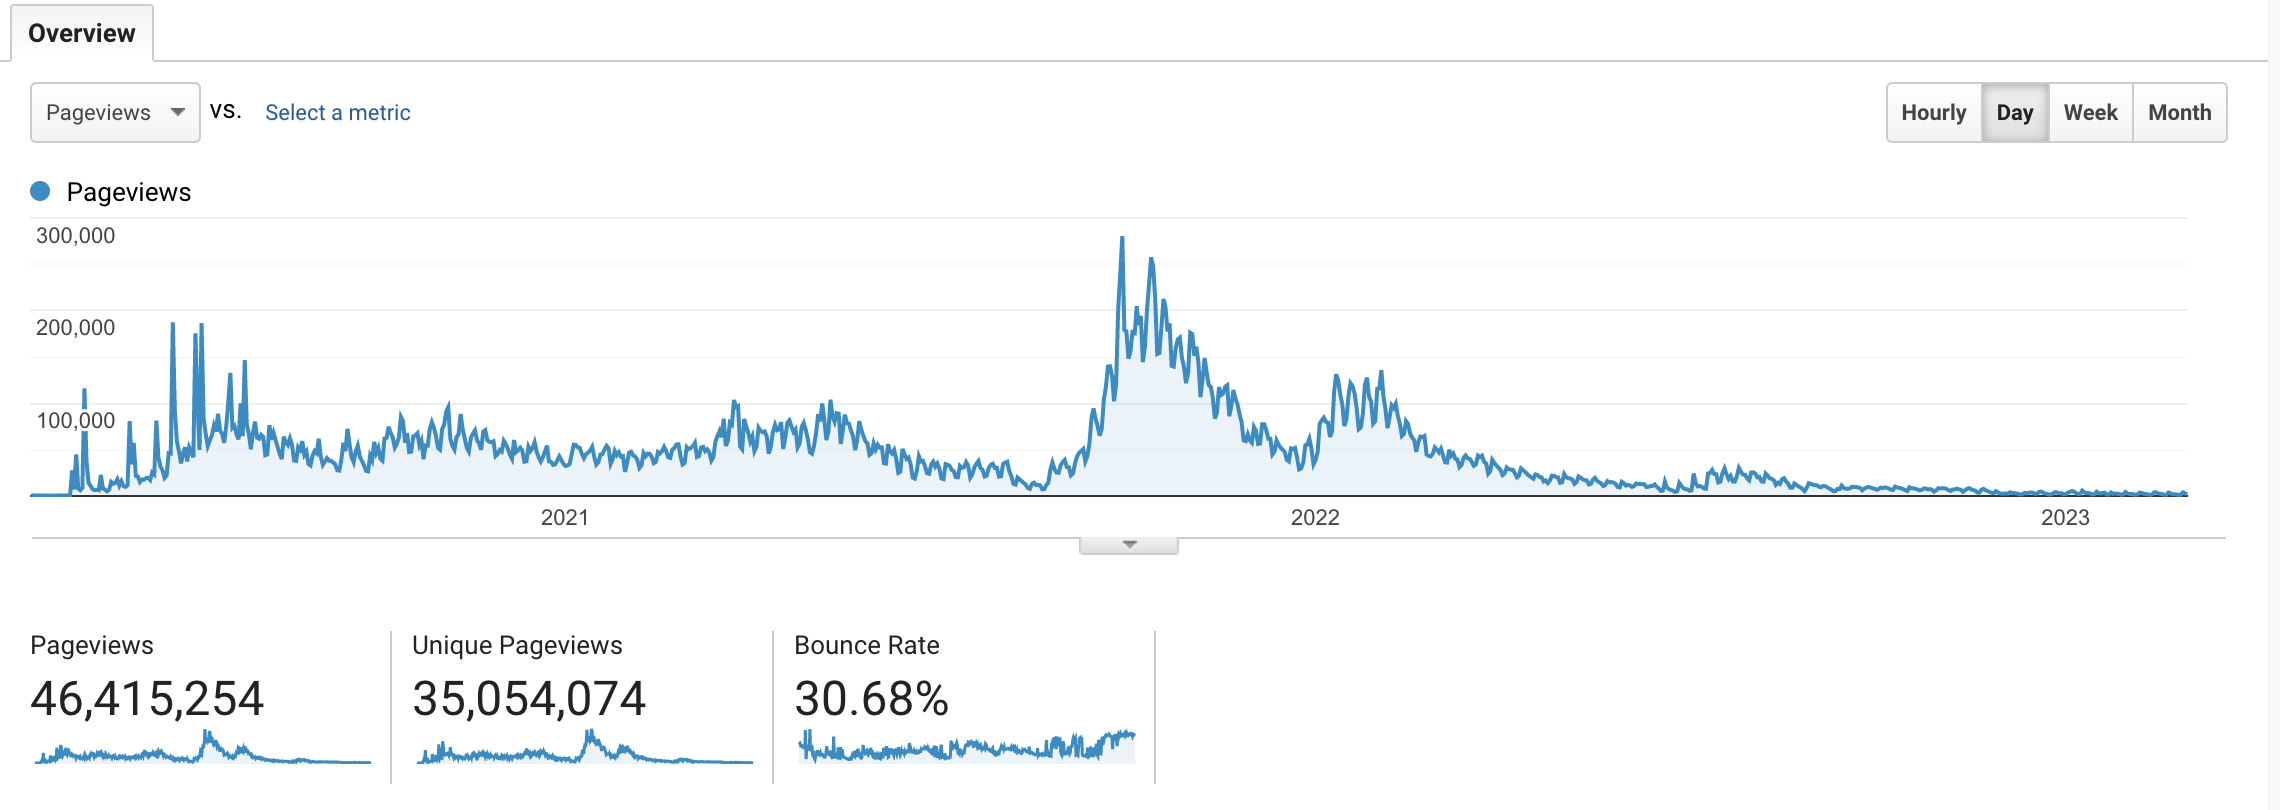
Between 2020 and 2026 more than 45 million graphics were directly viewed on the platform. It has been accessed more than 15 million times by 3+ million unique visitors from 200 countries. This data has been confirmed with Google Analytics. In addition to these direct accesses, many people saw the graphics picked up by the platform on TV, in news bulletins and talk shows, their number not being calculable.
The graphs and statistics on Graphs.ro have been picked up by almost all reputable publications in Romania: Televiziunea Română, Digi24, Antena 3, HotNews, G4Media, Libertatea, Newsweek, Biziday and many more. They constituted the basis of thousands of press articles. An indicative list of these articles can be accessed here.
In conclusion, it can be said, with the highest degree of certainty, that it would have been very difficult for a Romanian not to have seen, at least once, during the pandemic, a graph from Graphs.ro.
Problems encountered throughout our journey
This has certainly been a learning experience for me as it was a considerable effort, especially during the peak periods of the Covid waves, when the public appetite for data was huge.
The main problem was financing the platform, which did not receive any support from the government (or any other public entity) or private companies, but was rather self-financed from my own budget, advertisements and donations from the public. Server (hosting) costs were particularly high for a platform that had to support millions of monthly visitors.
Furthermore, since this platform uses public data, many times we encountered problems with the availability of data or their accuracy, problems that were persistently solved by media interventions.
Future
The Graphs.ro project brought a new approach to the transparency of medical data in Romania. I wanted to have set a benchmark for this and created a platform that I hope, will inspire, through quality, other similar projects, whether they are based on medical data or other public info.
By using this platform, the public has realized that data has value. Thus, the appetite for good, quality data has soared, as the public itself makes efforts to discover and find the best sources of information.
We have therefore decided to transform the platform from one focused exclusively on Covid. Now Graphs.ro will be a multipurpose platform, offering data collection and processing services for studies, surveys, market research, infographics and visuals.
Looking forward to working with you, dear customer, in this excitingly new chapter for Graphs.ro